Technical Patterns and Signals
Technical analysis is a method used to study market behavior by examining historical price movements, trends, and trading volumes. Rather than predicting exact future prices, it focuses on recognizing recurring patterns that may indicate potential shifts in market sentiment. By understanding these patterns, traders can develop a framework for observing trends and making more structured decisions.
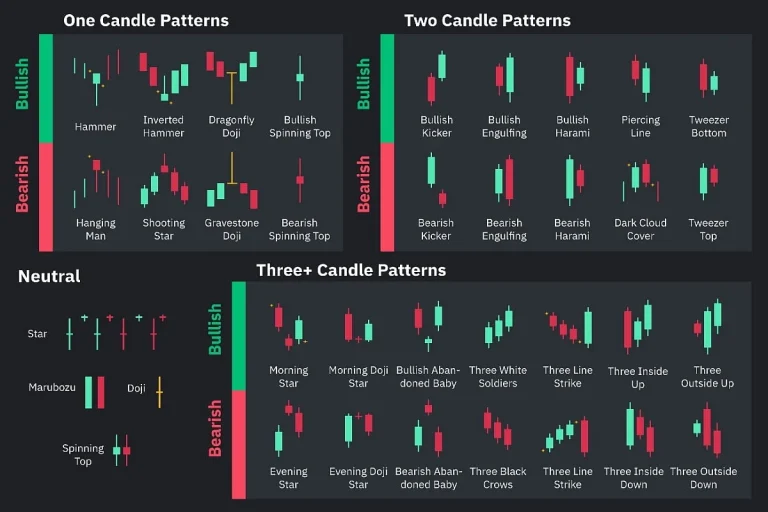
Charts are central to technical analysis. Candlestick patterns, trendlines, support and resistance levels, and moving averages provide visual cues that help interpret market dynamics. These tools do not guarantee outcomes but serve as guides to identify potential opportunities and areas of caution. Observing how these elements interact over time is essential for building a disciplined approach.
Volume is another key factor. Changes in trading volume often accompany significant price movements and can confirm the strength or weakness of a trend. Paying attention to spikes or declines in volume can help traders understand whether a price movement is supported by market activity or likely to be temporary.
Ultimately, technical analysis is about observation and pattern recognition rather than speculation. It encourages traders to focus on data, maintain discipline, and avoid emotional decision-making. By systematically interpreting charts and signals, market participants can approach trading with structured reasoning and better contextual understanding.